Time frames: 1hr and 15min
Indicato: 5ema(close-red), 6ema(Open-blue), 20ema(close green), Daily,
weekly, monthly pivot,Fibonacci retracement Weekly and Daily support and
resistants, Breakout-Eagle Indicator.
PAI: Anything traded online that respects technicals - Commodities, FOREX, INDEXES, SHARES ETC
SETUP:
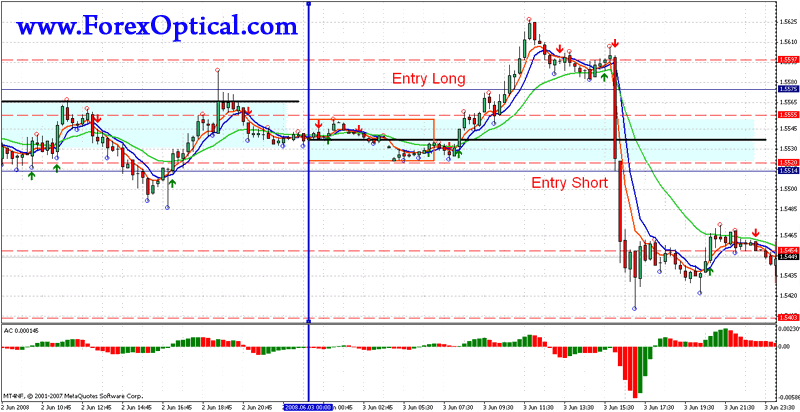
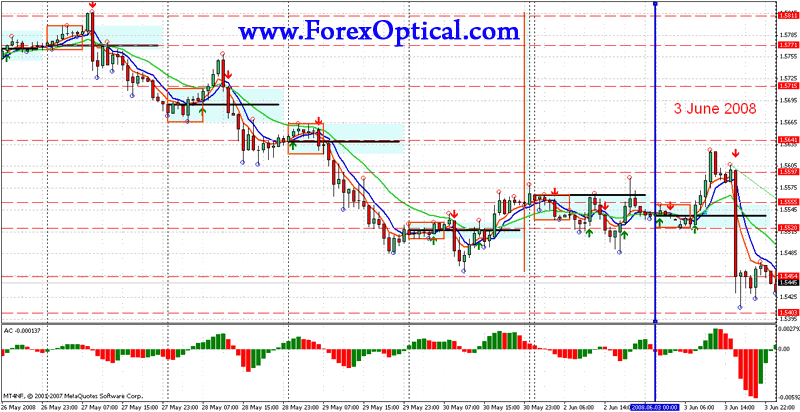
I will be using EUR/USD June 3 as an example.
Open the 1hr chart
plot the 5ema(close-red),6ema(open-blue), 20ema(close), add the
ema_crosses indicator activating alert, plot the resistant and support
lines using ur weekly and daily time frame, plot other S/R like pivots
and fibo retracments of daily, weekly and even monthly. add the
breakout_eagle indicator let ur parameter cover the fit 8hou candles of
the day in the 1h timeframe.
Plot all the indicato in another window of 15min time frame.
15 Minutes Charts
 | This image has been resized.
Click this bar to view the full image. The original image is sized
800x412. |

1 Hour Chart
 | This image has been resized.
Click this bar to view the full image. The original image is sized
800x412. |

ENTRY:
I have read a lot of research work on ema crosses and i have seen alot
of setups that are not practical at all. but what i will give hear seems
to be very easy, sure, and poise more confidence even for newbies to
apply.
Wait for the 5ema to cross 6ema in the 15min time frame. An alarm will
sound and an arrow will show you the direction. When you see the arrow,
this is what you should do. In the 15min time frame draw a vertical line
for visual aid and change the time frame to 1hour.
For you to enter a trade for short for example. If the arrow in 15min is
pointing down, as you change to 1hr tf, the 5ema/6ema must be crossing
and very obvious, then move back to 15min and make an entry few pips
below the candle with the arrow. DO NOT PLACE A TRADE IF THE 5EMA/6EMA
ARE NOT CROSSING.
EXIT:
This is very vital. You dont need for opposite ema cross before you
checkout/exit, this many not be funny sometime like more people believe.
Your next exit should be the next support or resistant line.
I have attached my weekly and daily template for MT4 support and
resistant lines. Additionally you can add pivots of daily, weekly and
fibonacci retracement of weekly, daily and or 4h swing highs and low
You need all the S/R lines above. Why? Online trading is a big challenge
and with lots of drama, as price setout in a direction it has a
destination which is a support or resistant point. So if you rely on a
point, you may regret because another vital point may be a barrier to
meeting your assumed point.
The knowledge of daily range can also help you in planning your entry
and exit.
I hope you have a happy trading.
Download :
Indicato:
Code:
http://yourfileplace.com/files/156697594/Indicator.www.forexoptical.com.rar.html
Template:
Code:
http://yourfileplace.com/files/156697398/Templatewww.ForexOptical.com.rar.html